2D gas laboratory
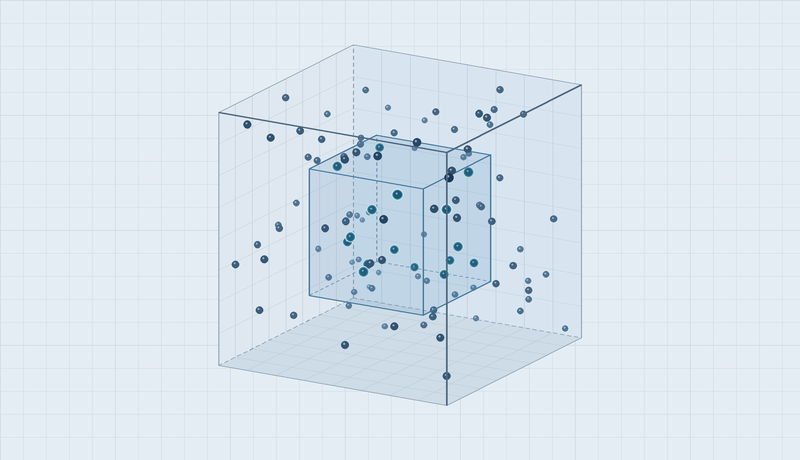
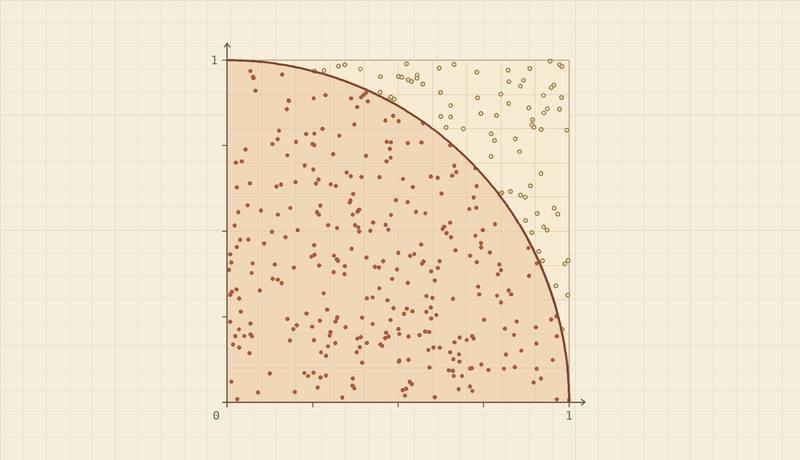
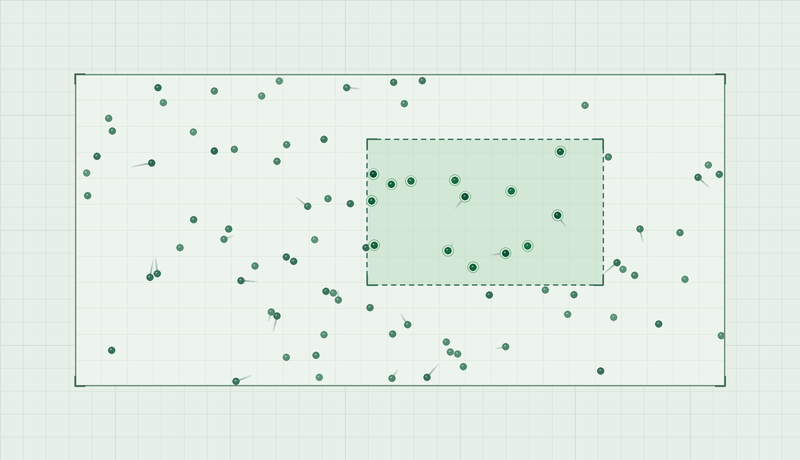
Draw a box in a gas of colliding disks. Count particles, track a tracer or measure the push on a wall.
Open lab2D gas laboratory activities
-
How many particles are in the box?
In More options, set Particles to 100. Draw a box covering a quarter of the chamber. Compare the observed count with the expected 25.
-
How often is a small box empty?
In More options, set Particles to 100. Draw a box covering about 1% of the chamber and select exactly 0. Compare the observed frequency with the binomial and Poisson predictions.
-
Does halving the area halve the variance?
In More options, set Particles to 100. Sample half the chamber, then a quarter. Compare the observed variances with the binomial predictions of 25 and 18.75.
-
Do the two halves fluctuate independently?
Draw a box over the left half. Pause at several times and subtract the left count from the total to find the right count. Track how the two change together.
-
How often does the count reach a threshold?
In Region count distribution, select Both models. Set a count and switch between exactly, at least and at most to compare observed, binomial and Poisson probabilities.
-
How are speeds distributed in two dimensions?
Select Speed and enable Equilibrium prediction. Change Temperature and compare the histogram with the Rayleigh curve.
-
How is kinetic energy distributed among the disks?
Select Energy and enable Equilibrium prediction. Change Temperature and watch how the exponential energy distribution changes scale.
-
How do collisions redistribute speed?
Under Initial conditions, choose Equal speeds, Fast and slow particles or One moving particle. Select Load preset, then Resume, and follow the Speed histogram.
-
How does particle mass affect speed and energy?
Try Two masses, equal speeds, then Three masses, equal speeds under Initial conditions. For each, select Load preset and Resume. Compare the Speed and Energy histograms.
-
How does gas fill an empty half of the chamber?
Choose Free expansion under Initial conditions. Select Load preset, then Resume, and follow the count in the initially empty right half.
-
What path does a heavy tracer follow?
Choose Brownian tracer under Initial conditions, then select Load preset and Resume. Open More experiments to show the tracer path or hide the surrounding gas.
-
How much momentum does each impact transfer?
Under Measure, select Left and enable Show wall impacts. Match the flashes and arrows in the chamber to the impulse marks below the pressure trace.
-
How does averaging change a pressure reading?
Switch Recent averaging window from 0.25 to 10 simulated seconds. Compare the fluctuations in Recent average with the average since measurement started.
-
How does pressure compare with the dilute-gas prediction?
Choose Small particles under Initial conditions, select Load preset and Resume. Measure All walls and compare the average with the dilute-gas prediction at two temperatures.
-
Does gravity change pressure equally at the top and bottom?
Open More experiments and increase Gravity. Under Pressure from wall impacts, measure Top and Bottom in turn for the same simulated duration.
-
What happens when the bottom wall heats the gas?
Open More experiments, enable Heat bottom wall and set Wall temperature above the initial gas temperature. Select Energy and follow the changing histogram.